
Goal 2 - Metric 2
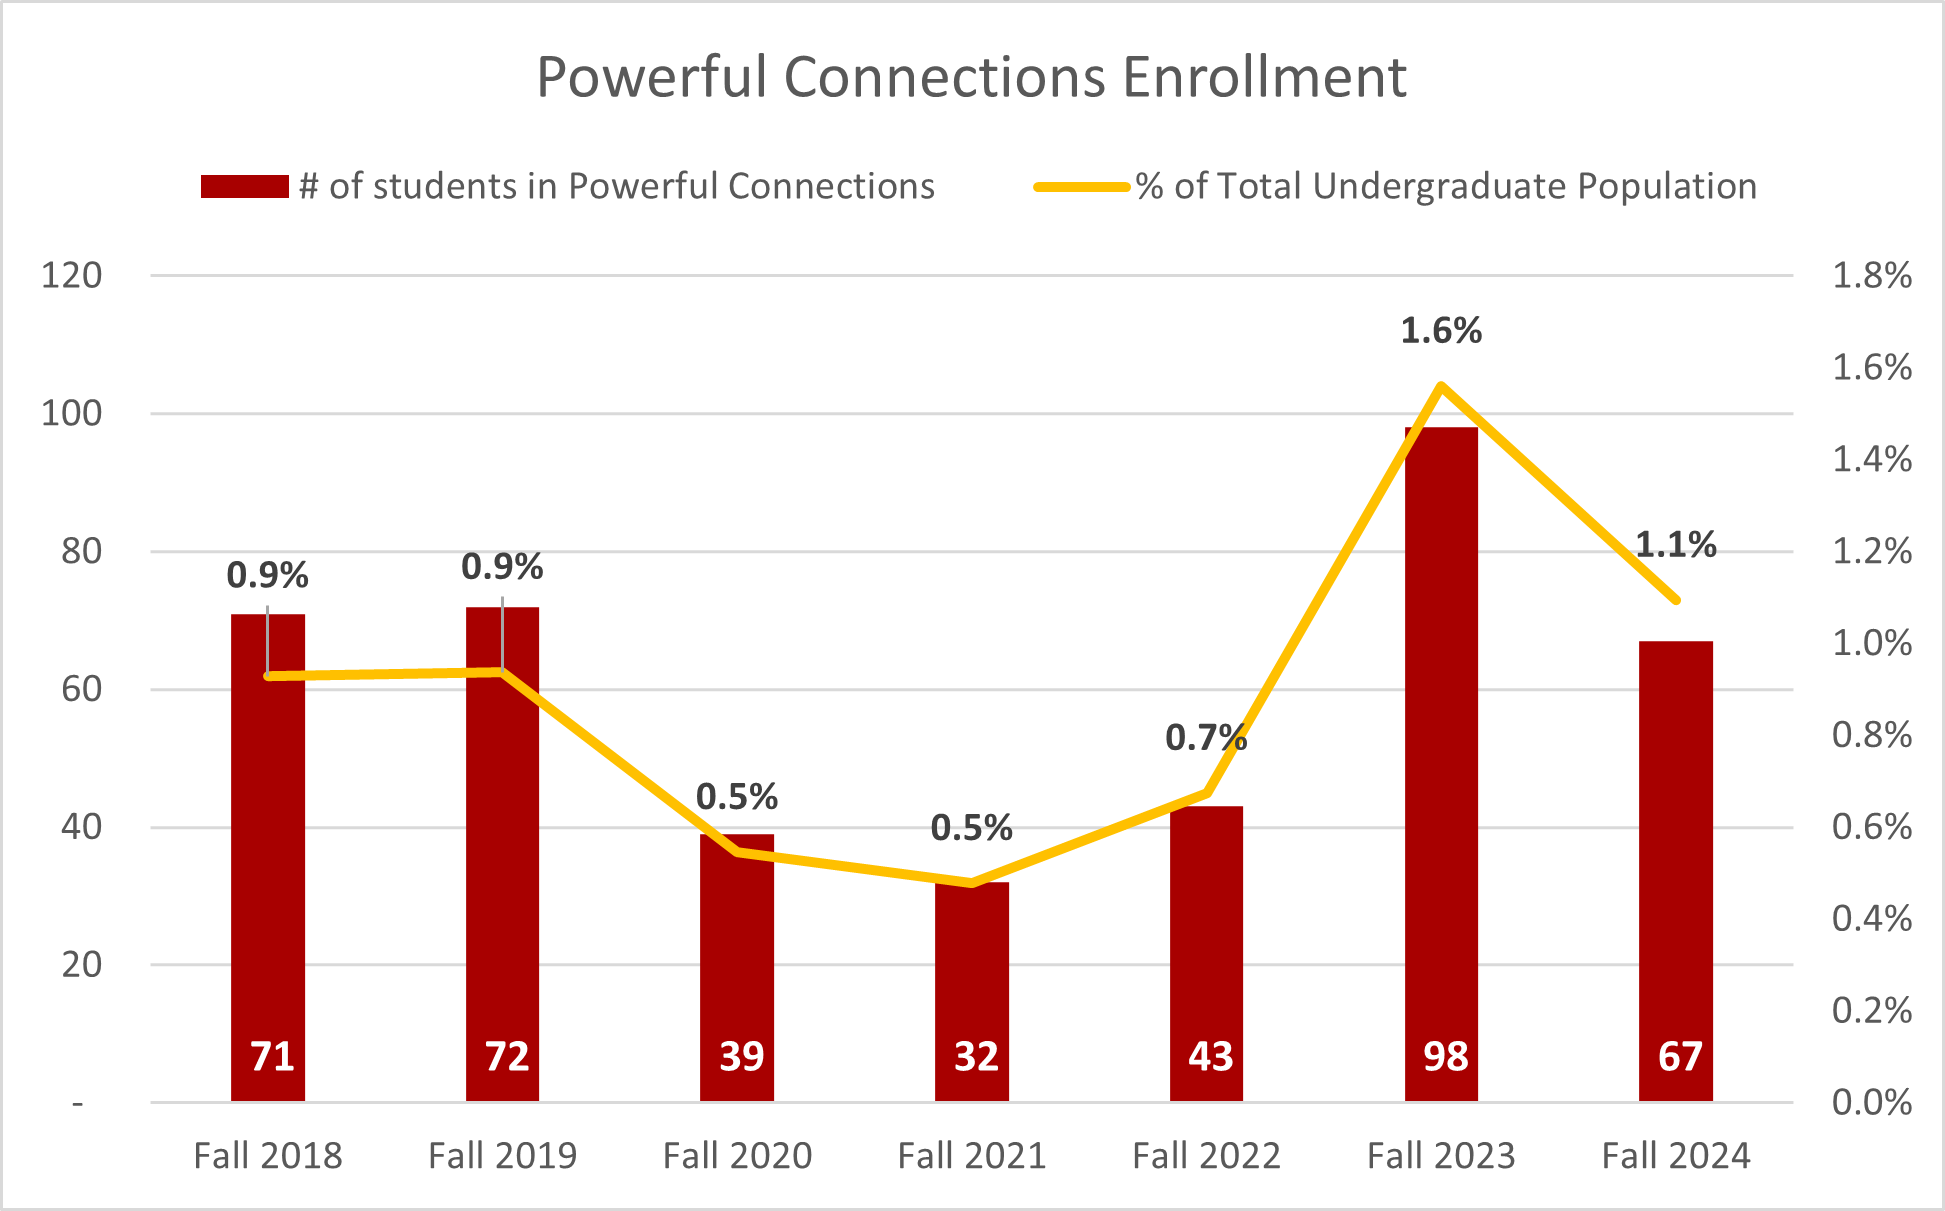
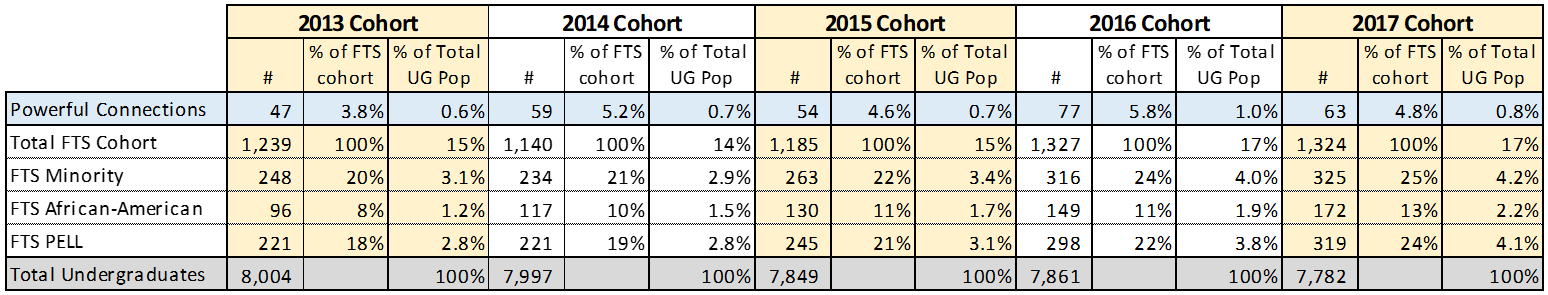
Expand Powerful Connections
83% Second-year Retention Rate in Powerful Connections
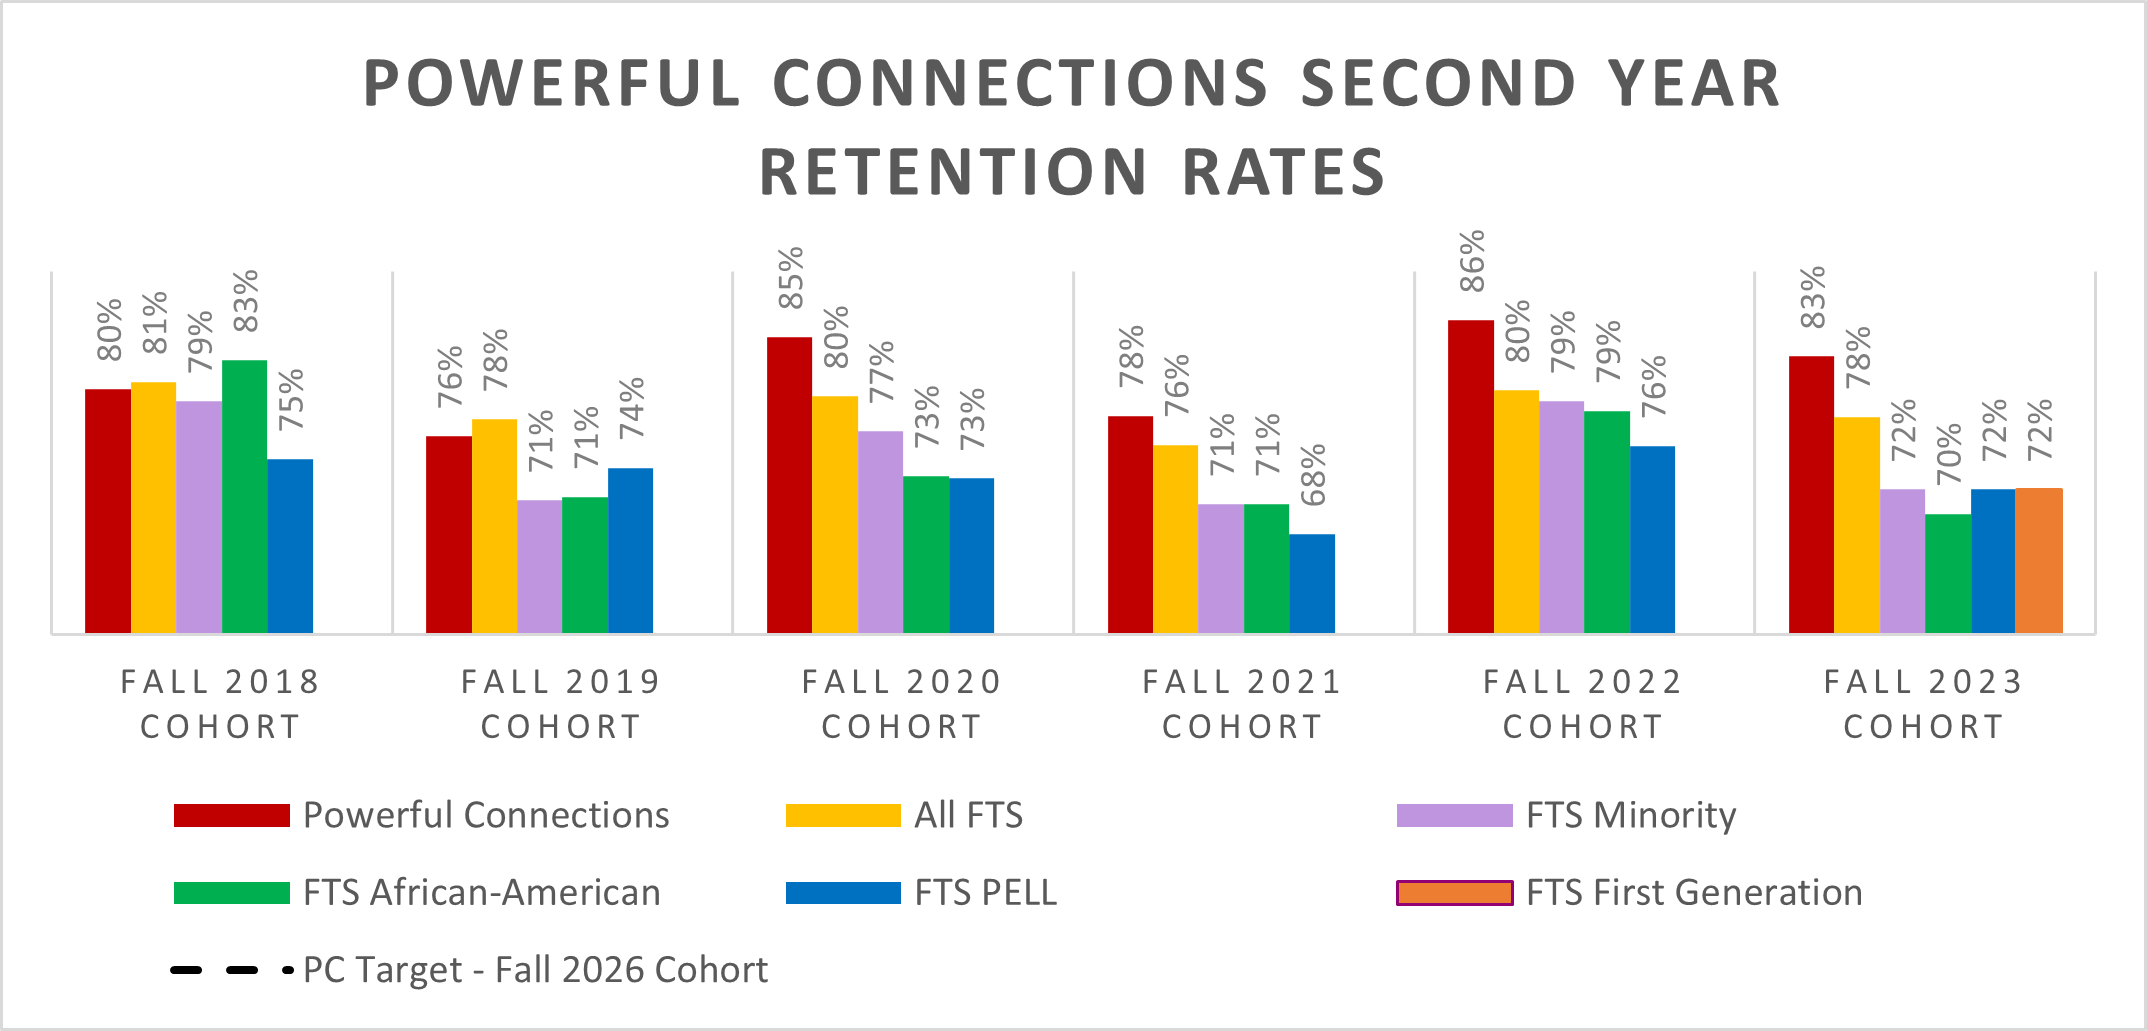
Baseline: Fall 2018 Cohort – 80%
Current year: Fall 2023 Cohort – 83%
Target: Fall 2026 cohort – xx%
Current year 83% is lower/higher than the target of %.
Value Comparison: When comparing this value for improvement and targets, a higher value is better.
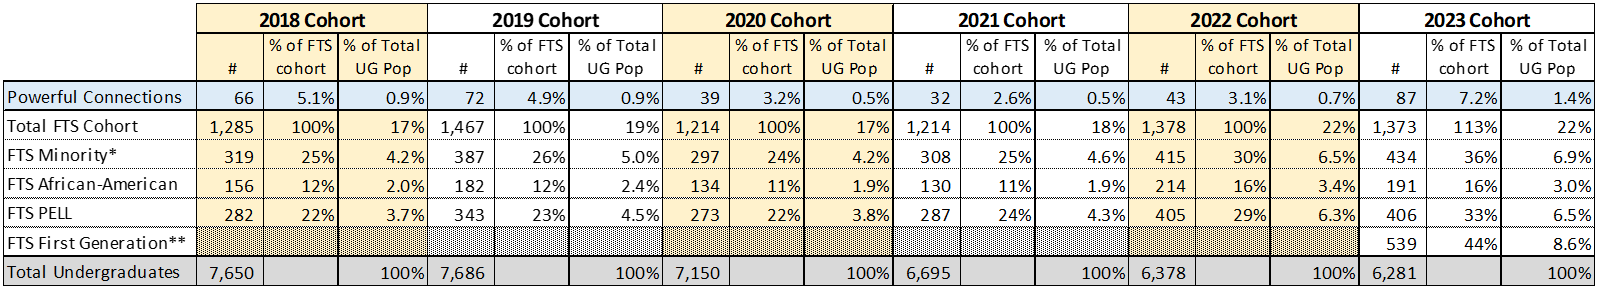
*Minority includes African-American, American Indian/Alaskan Native, Asian, Hispanic, Native Hawaiian/Pacific Islander, and Two or more races. Minority does NOT include NRA (US Nonresidents) or Unknown Race/ethnicities
**First Generation data became available in Fall 2023 through CommonApp and SLATE.
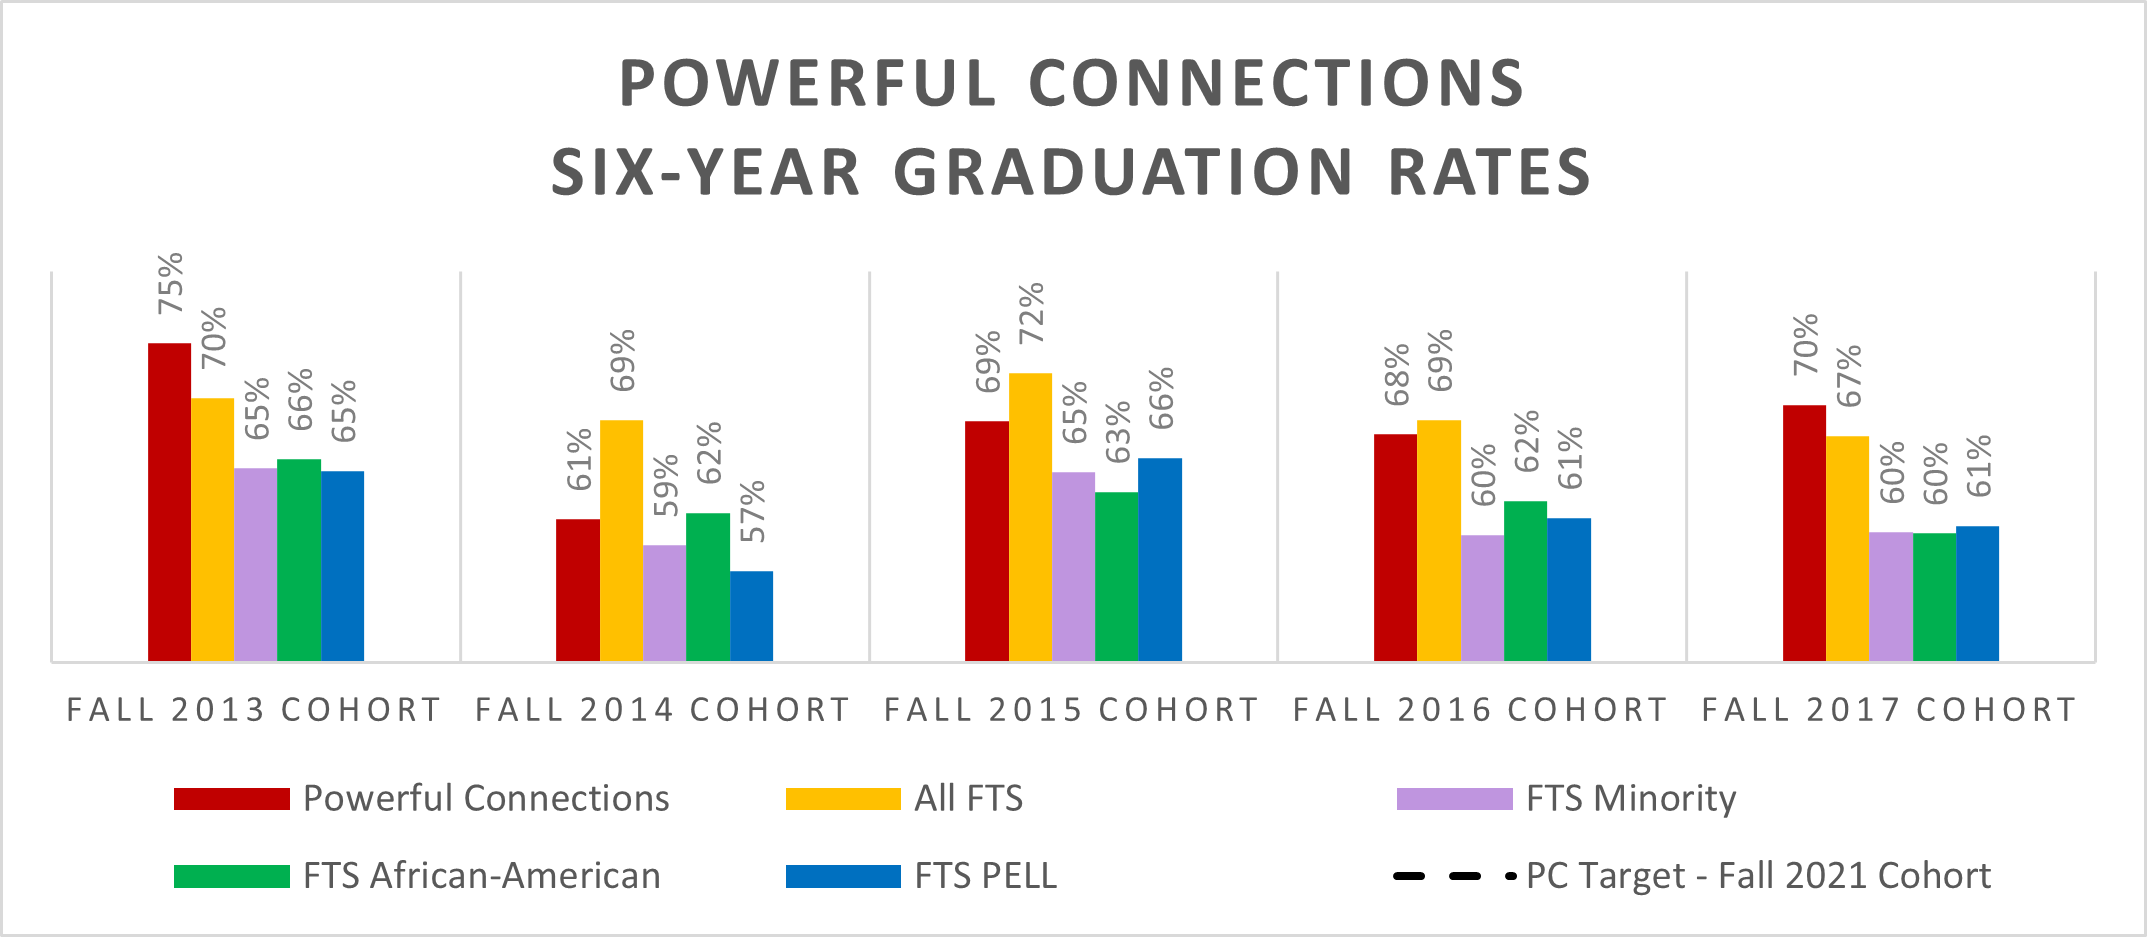
Baseline: Fall 2013 Cohort – 75%
Current year: Fall 2017 Cohort – 70%
Target: Fall 2021 cohort – xx%
Current year 70% is lower/higher than the target of %.
Value Comparison: When comparing this value for improvement and targets, a higher value is better.
*Minority includes African-American, American Indian/Alaskan Native, Asian, Hispanic, Native Hawaiian/Pacific Islander, and Two or more races. Minority does NOT include NRA (US Nonresidents) or Unknown Race/ethnicities
Source: Fall longitudinal files