
Goal 3 - Metric 2
Increase enrollment of minority students and other demographics
30% Minority Percentage of Total Institutional Enrollment
Minority percentage of total enrollment

Baseline: Fall 2019 – 27%
Current year: Fall 2024 – 30%
Target: Fall 2027 – %
Current year 30% is lower/higher than the target of %.
Value Comparison: When comparing this value for improvement and targets, a higher value is better.
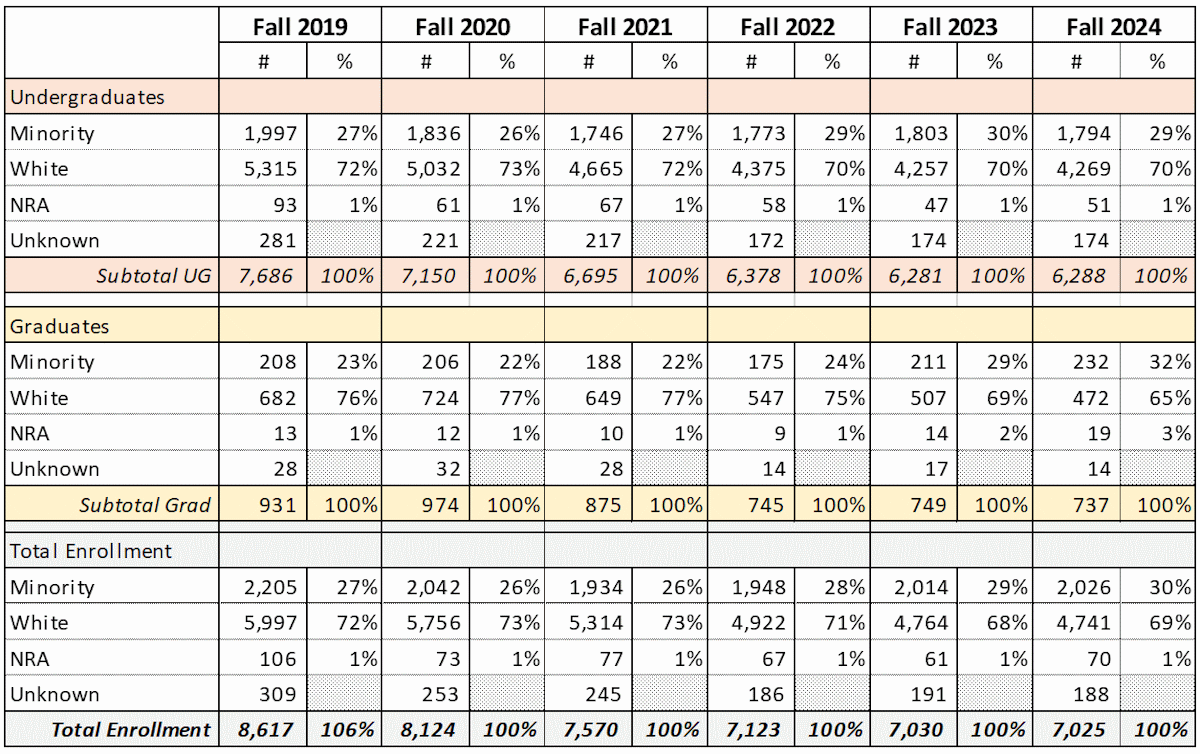
*Minority includes African-American, American Indian/Alaskan Native, Asian, Hispanic, Native Hawaiian/Pacific Islander, and Two or more races. Minority does NOT include NRA (US Nonresidents) or Unknown Race/ethnicities
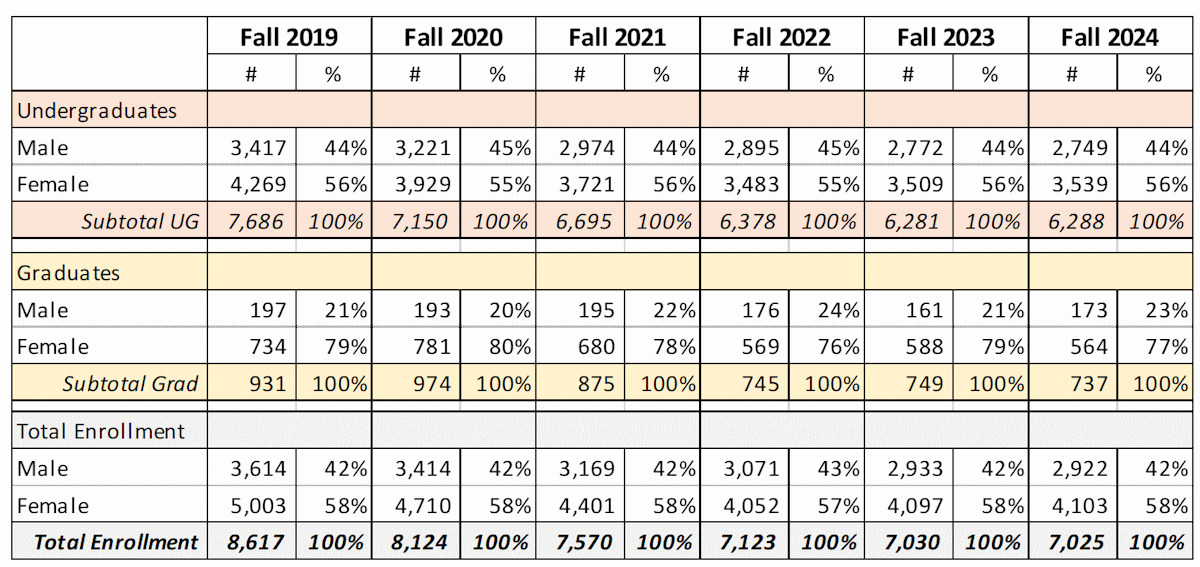
Gender percentages of total enrollment

Baseline: Fall 2019 – Male = 42%; Female = 58%
Current year: Fall 2023 – Male = 42%; Female = 58%
Target: Fall 2027 – Male = 50%; Female = 50%
This year, the current ratio of 42/58% is 8 percentage points below the target of 50/50%
Value Comparison: When comparing this value for improvement and targets, an equal value is better.
Enrollment Dashboard Chart
Pell recipient percentage of undergraduate enrollment

Baseline: Fall 2019 – 23%
Current year: Fall 2024 – 28%
Target: Fall 2027 – %
Current year 21% is lower/higher than the target of %.
Value Comparison: When comparing this value for improvement and targets, a higher value is better.
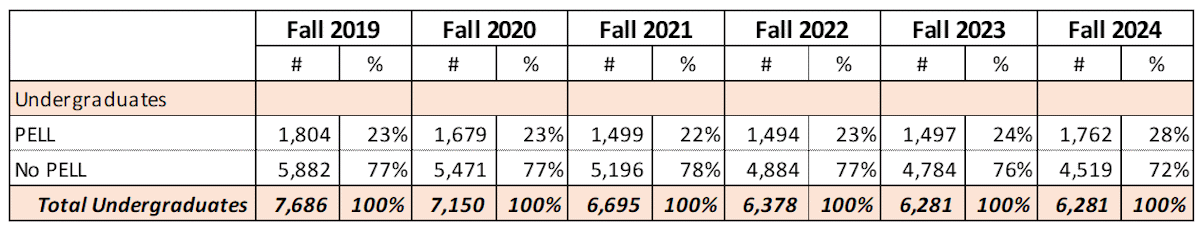
Source: Fall census POP files